Linear Regression – Data VisualiZation using Seaborn
deeplearning.org.uk – Linear Regression

Linear Regression
In statistics “Linear regression” is an approach for modeling the relationship between an independent quantitative variable x and a dependent quantitative variable y . This is called “simple linear regression“.
In case there are multiple independent variables x1, x2, …, xk , then the approach is called “multiple linear regression“.
If the dependent variable y is categorical (and not quantitative), for example we examine if y exists or not (1 or 0), then the approach is different and it is called “logistic linear regression“. We are going to examine logistic regression later.
There are numerous free resources for linear regression on the web, I recommend to check youtube videos by Brandon Foltz.
Data VisualiZation using Seaborn, Python’s library
We are going to see how easy it is to visualize linear regression using python’s library Seaborn.
Seaborn comes with a couple of datasets included. One of them is called “tips” and it contains data of tips, total_bill, gender of the customer, if they were smokers or not, etc.
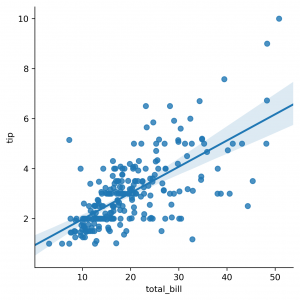
Looking the data carefully, we can realise that there is a linear relationship between the “total_bill” and the “tip”: the higher the “total_bill”, the higher the “tip” is; the lower the “total_bil”, the lower the “tip”.
Let’s show this linear relationship using Seaborn: