Seaborn Matrix Plots
deeplearning.org.uk – Seaborn Matrix Plots
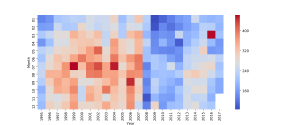
Heatmap of properties sales volume in Reading, UK

Learn how to query online data, provided by gov.uk, about property sales in UK and create a “heatmap”, which is a “Matrix Plot” showing properties sales-volume for Reading, UK during the years 1995-2017.
We use Python to process the data and create a “Pivot table” with months as rows, years as columns and sales-volume as data. You can realise the huge impact of crisis on the property market after 2008 and you can observe a pattern of increasement during the summer months.
How to create this Heatmap
Loading
Sorry, something went wrong. Reload?
Sorry, we cannot display this file.
Sorry, this file is invalid so it cannot be displayed.